
Two posts ago I hit a bug where Ollama was silently truncating Cline's context window mid-task, and the agent just started "forgetting" the job rather than erroring out. I fixed it by baking a larger num_ctx into a custom Modelfile and moved on.
What I didn't do at the time was ask the more useful question: how would I have caught that before it wasted an evening, instead of after? The answer is embarrassingly simple — I wasn't looking at any numbers at all. No cost meter running means it's easy to convince yourself there's nothing to measure. That's backwards. When money isn't the constraint, compute, time, and heat are, and all three trace straight back to token counts.
Why, When It's Free
"Free" is doing a lot of work in that sentence. Running a 14b model locally on a MacBook Air M4 isn't free of everything:
- Context budget. Every model has a context window, and mine had already burned me once. Prompt tokens plus conversation history plus tool output all eat from the same budget, and Ollama won't tell you when you're close to the edge — it just quietly drops the oldest tokens.
- Thermal reality. The Air has no fan. A long agent session generating thousands of tokens back-to-back will throttle the chip, and throughput quietly degrades the longer the session runs. If you're not watching tokens-per-second over time, "the model feels slower today" is just a vibe, not a diagnosis.
- Comparability. The only way to honestly answer "is Qwen2.5-Coder:14b actually faster than a 32b model on my hardware, or does it just feel that way" is to have numbers from both, not a memory of how the last session went.
None of this needs a billing dashboard. It needs the same instinct I'd apply to any pipeline I actually cared about: instrument it before you need the data, not after something breaks.
What Ollama Already Hands You
The good news is Ollama isn't hiding this. Every non-streamed response from /api/generate or /api/chat includes timing and token fields for free:
{
  "model": "qwen2.5-coder-agent",
  "response": "...",
  "done": true,
  "total_duration": 5043500667,
  "load_duration": 5025959,
  "prompt_eval_count": 26,
  "prompt_eval_duration": 325953000,
  "eval_count": 290,
  "eval_duration": 4709213000
}
All durations are in nanoseconds. prompt_eval_count is input tokens, eval_count is output tokens, and generation speed is:
tokens_per_second = eval_count / (eval_duration / 1_000_000_000)
The problem isn't that this data doesn't exist — it's that Ollama doesn't persist it anywhere. Each response is a one-off. If you want to see trends over time, or compare models, or even just know whether a given prompt is about to hit the context limit, you have to log it yourself.
The Solution: ollama-usage
Rather than scatter a wrapper function across whatever script happens to be calling Ollama that week, I built this properly and pushed it as its own repo: github.com/fynes-forge/ollama-usage. A small uv-managed package, four modules and a CLI, structured the same way I'd structure anything meant to outlive a single afternoon.
ollama-usage/
├── .github/
│   ├── workflows/          ← CI/CD pipelines
│   ├── ISSUE_TEMPLATE/     ← Bug reports, feature requests
│   ├── PULL_REQUEST_TEMPLATE/
│   └── copilot/            ← GitHub Copilot instructions
├── docs/                   ← Documentation
src/ollama_usage/
    ├── config/
    │   ├── __init__.py
    │   ├── branding.py    # shared brand colour tokens
    │   └── config.py      # load_config() — read env vars into a dict
    ├── __init__.py
    ├── logger.py      # call_and_log() — call Ollama, append usage to JSONL
    ├── budget.py      # check_context_budget() — warn before context overflow
    ├── proxy.py       # transparent proxy — captures Cline/other direct clients
    ├── report.py      # summary() and plot() — query the log with DuckDB
    ├── dashboard.py   # Streamlit dashboard
    └── cli.py         # `ollama-usage log|report|plot|dashboard|proxy`
├── tests/                  ← Test suite
├── AGENTS.md               ← AI agent conventions
├── CONTRIBUTING.md         ← Contribution guide
├── CHANGELOG.md            ← Release history
└── README.md               ← This file
It's genuinely clone-and-run — no manual file assembly, no editing constants before it works:
git clone https://github.com/fynes-forge/ollama-usage.git
cd ollama-usage
uv sync
uv resolves every dependency straight from pyproject.toml — requests, duckdb, pandas, matplotlib, streamlit, plotly, typer, flask, rich. No pip installs to remember, no virtualenv to activate by hand.
However, if you wish to install it then you can do so with your preferred package manager:
uv tool install ollama-usage --from https://github.com/fynes-forge/ollama-usage/releases/download/v0.1.0/ollama_usage-0.1.0-py3-none-any.whl
Log a real call:
uv run ollama-usage log \
  --model qwen2.5-coder-agent \
  --prompt "Summarise breaking changes in go_router 14 to 17." \
  --tag dependabot-review
That does three things in one call: hits Ollama, appends a line to ~/ollama-usage.jsonl, and checks the prompt against your context budget — which is the part that actually would have caught the truncation bug from a few posts back:
⚠️ Context at 91% of budget (29820/32768 tokens)
No warning means you're fine; a warning means the model is about to start quietly forgetting the start of your conversation.
The argument --num-ctx defaults to 32768 to match the Modelfile from the Cline post — override it if yours differs.
Launch the dashboard:
uv run ollama-usage dashboard
This is the part I really wanted — a proper dashboard, not just a terminal table. It's a small Streamlit app, bound to 0.0.0.0:8501 by default, so it's reachable from any device on your network, not just the laptop running it. Point a browser at http://<your-ip>:8501 from your phone or another machine and it's there.
If you want to keep things local you can pass --host 127.0.0.1 to restrict it.
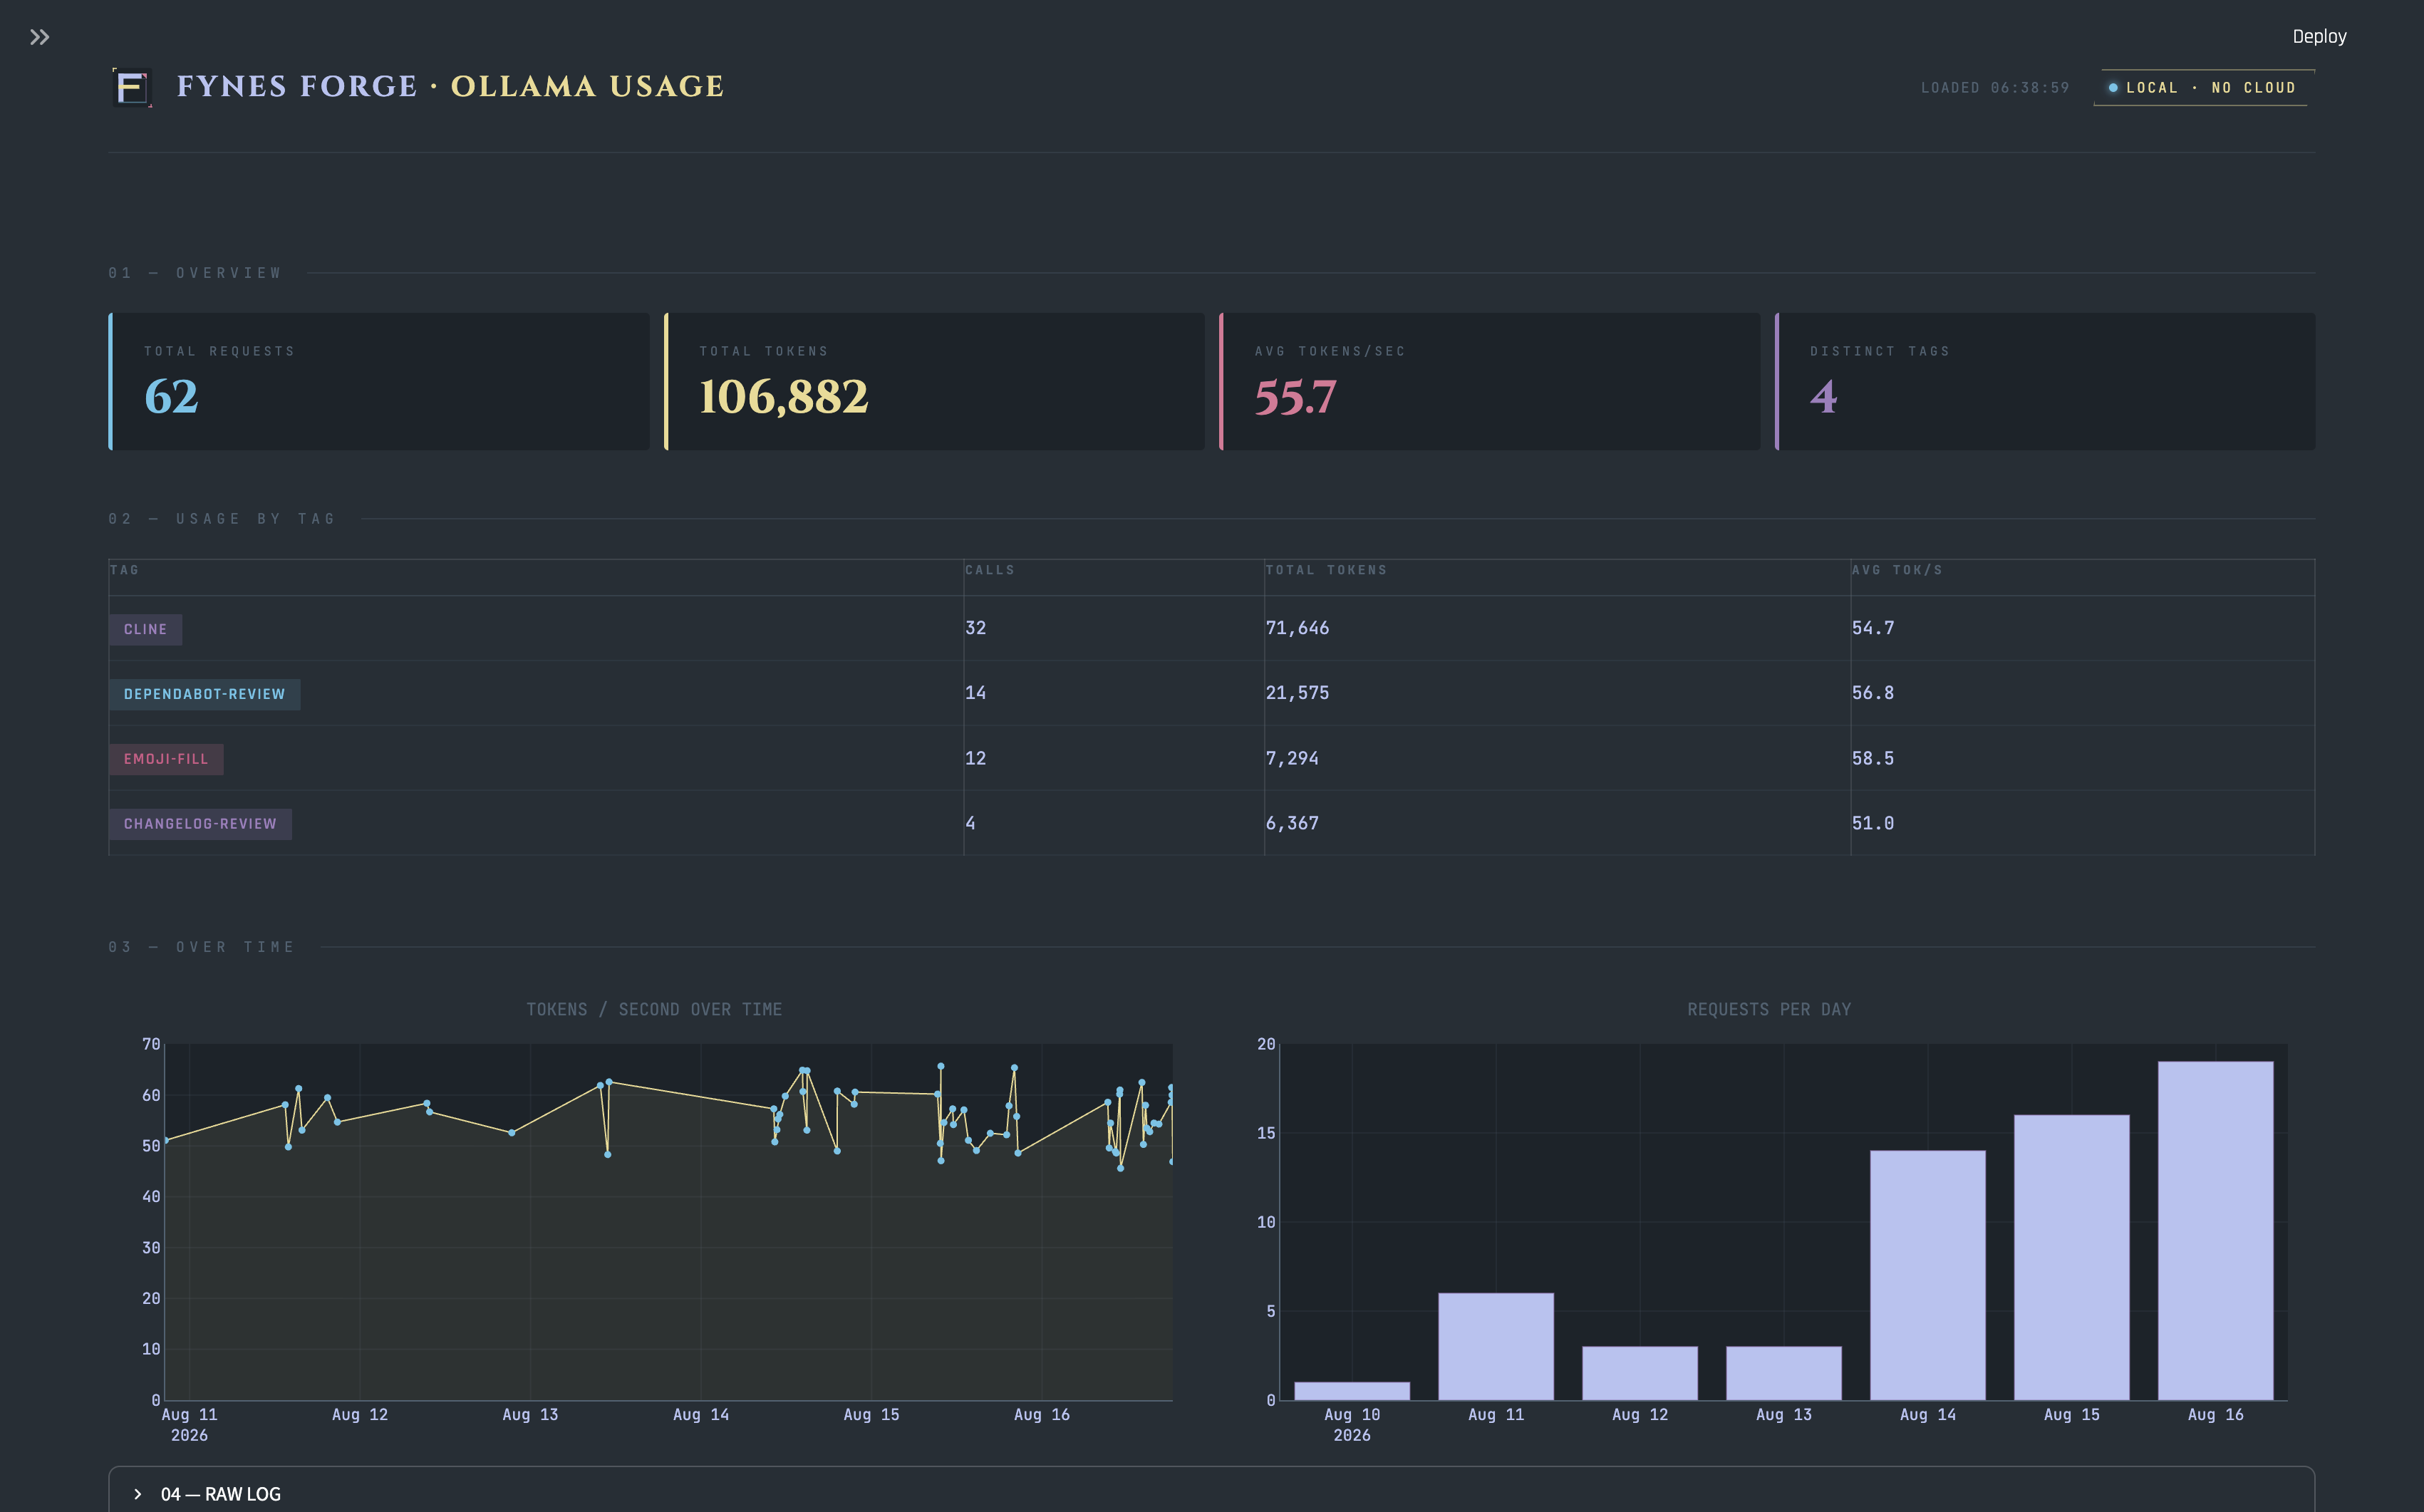
The dashboard shows total requests, total tokens, average tokens/sec, a per-tag breakdown table, tokens/sec over time, and requests per day — everything the terminal report and plot commands show separately, in one place, live.
Making It Look Like Something, Not Just Work
The first version of the dashboard used Streamlit's defaults — st.metric() cards, st.line_chart(). It worked, and it looked like every other Streamlit demo on the internet, but as this is going to live in the fynes-forge ecosystem I wanted this to look like it belonged there.
I restyled it against the actual Fynes Forge brand — the same palette and type system as the rest of this site: Cinzel for headings, Rajdhani for body text, JetBrains Mono for labels and data, the dark blue/gold/cyan/pink accent set. The header even reuses the real logo mark rather than a placeholder icon. st.metric() and st.line_chart() can't take that level of styling, so the KPI cards became hand-built HTML and the charts moved to Plotly, which actually exposes font, colour, and gridline control instead of a fixed default theme.
That swap surfaced a genuinely good gotcha, it's easy to hit and confusing when you do: I built the KPI cards as clean, nested, indented HTML —
def _kpi_card(label, value, accent):
    return f"""
    <div class="ff-kpi" style="--accent: {accent}">
        <div class="ff-kpi-label">{label}</div>
        <div class="ff-kpi-value">{value}</div>
    </div>
    """
— and every card rendered as literal escaped text on the page instead of an actual card. st.markdown() runs content through a Markdown parser before rendering, and standard Markdown treats any line indented four or more spaces as a literal code block.
The fix is a small normaliser that flattens every line to zero indentation before it reaches st.markdown():
def clean_html(raw: str) -> str:
    return "\n".join(line.strip() for line in raw.strip("\n").splitlines())
And now the KPI cards render as expected.
CSS block: 0 indented lines (should be 0)
KPI card: 0 indented lines (should be 0)
Small bug, and one more reason not to trust a UI change until you've actually inspected the output it produces.
I did think about wiring this into Open WebUI instead, since it already sits in front of Ollama and shows tokens/s per response but ultimately decided against it.Open WebUI is a chat interface, and I wanted this to stay its own thing.
So what does it look like? Here's a screenshot of the dashboard running on my laptop, with a few days of Cline traffic logged:
Does This Actually Track Cline?
No — not with just the log command anyway. Cline is a VS Code extension, and it doesn't call ollama-usage log when it talks to Ollama.
To capture Cline's traffic, you need to run a small proxy that sits between Cline and Ollama. The proxy is transparent — it doesn't change the request or response in any way, it just logs the usage on the way past.
uv run ollama-usage proxy
Running the proxy is just the first step. The second step is to point Cline at it instead of Ollama directly. The proxy prints a message on startup:
- In VS Code, open Cline's settings (the gear icon in the Cline sidebar).
- Find the Ollama provider section and its Base URL field — it defaults to
http://localhost:11434. - Change it to
http://localhost:11435(or whatever--portyou passed the proxy) and save. - Send Cline a normal request, then check it actually landed:
Proxying http://0.0.0.0:11435 -> http://localhost:11434
Point Cline's Ollama Base URL at http://localhost:11435 to capture its traffic.
To verify the proxy is actually logging, check the last line of the log file:
tail -n 1 ~/ollama-usage.jsonl
If that prints a line with "tag": "cline", it's wired up correctly. If nothing new appears, the Base URL change didn't take — double check it against what the proxy printed on startup, not against what you meant to type.
It is also worth noting that currently the proxy has two honest limits:
- Everything through one proxy instance shares a single
--tag(clineby default) — the proxy can see the tokens, not the task. If you wantdependabot-reviewvsemoji-fill-level granularity from Cline specifically, that's a restart-with-a-different-tag-per-session compromise, not something the proxy can infer on its own. - Only traffic actually routed through the proxy gets logged. Point Jan or a stray
curlcommand at:11434directly and it's invisible to this log, same as before. The proxy only sees what's pointed at it.
That being said, the proxy is still a useful tool for capturing Cline's traffic without needing to change any of Cline's code. It also works for any other Ollama client that can be pointed at a different base URL. In the future, I may add a more sophisticated router that can tag by request path or other metadata, but for now this is a simple, low-friction way to get the data.
CLI not enough? Use it as a library
If a CLI call isn't the shape you need, everything's usable as a plain library too:
from ollama_usage.logger import call_and_log
from ollama_usage.budget import check_context_budget

resp = call_and_log(model="qwen2.5-coder-agent", prompt=my_prompt, tag="my-task")
check_context_budget(resp["prompt_eval_count"], num_ctx=32768)
Full source is in the repo — worth a read there rather than as a wall of code pasted into a blog post; budget.py and report.py are still tidy one-screen modules, proxy.py and logger.py aren't much bigger, and cli.py/dashboard.py have grown into the two places most of the actual work now lives.
The Actual Point
None of this is about cost. It's about the fact that "no bill" doesn't mean "no resource." Context window, thermal headroom, and comparative model performance are all real constraints on this hardware, and every one of them is sitting in the response body Ollama already sends back — mostly unread, until you decide to log it.